Le journal d'un trader
Ici, je vous partage les outils que j'utilise pour trader, en scalp, swing et long terme. Tout est gratuit, et j'essaie d'améliorer les outils au fur et à mesure que je les utilise.
Tools
Le biais de marché en temps réel : news mondiales, modèles quantitatifs et machine learning réunis sur un seul écran. Avec le calculateur de lots et 617 indicateurs TradingView à télécharger.
Propfirm
Les performances publiées preuve par preuve, et bientôt le guide complet : choisir sa firme, passer l'évaluation, durer, encaisser.
Long Terme
L'algorithme QJM, un portefeuille quantitatif suivi en direct, rebalancé chaque mois et publié sans filtre.
Performances
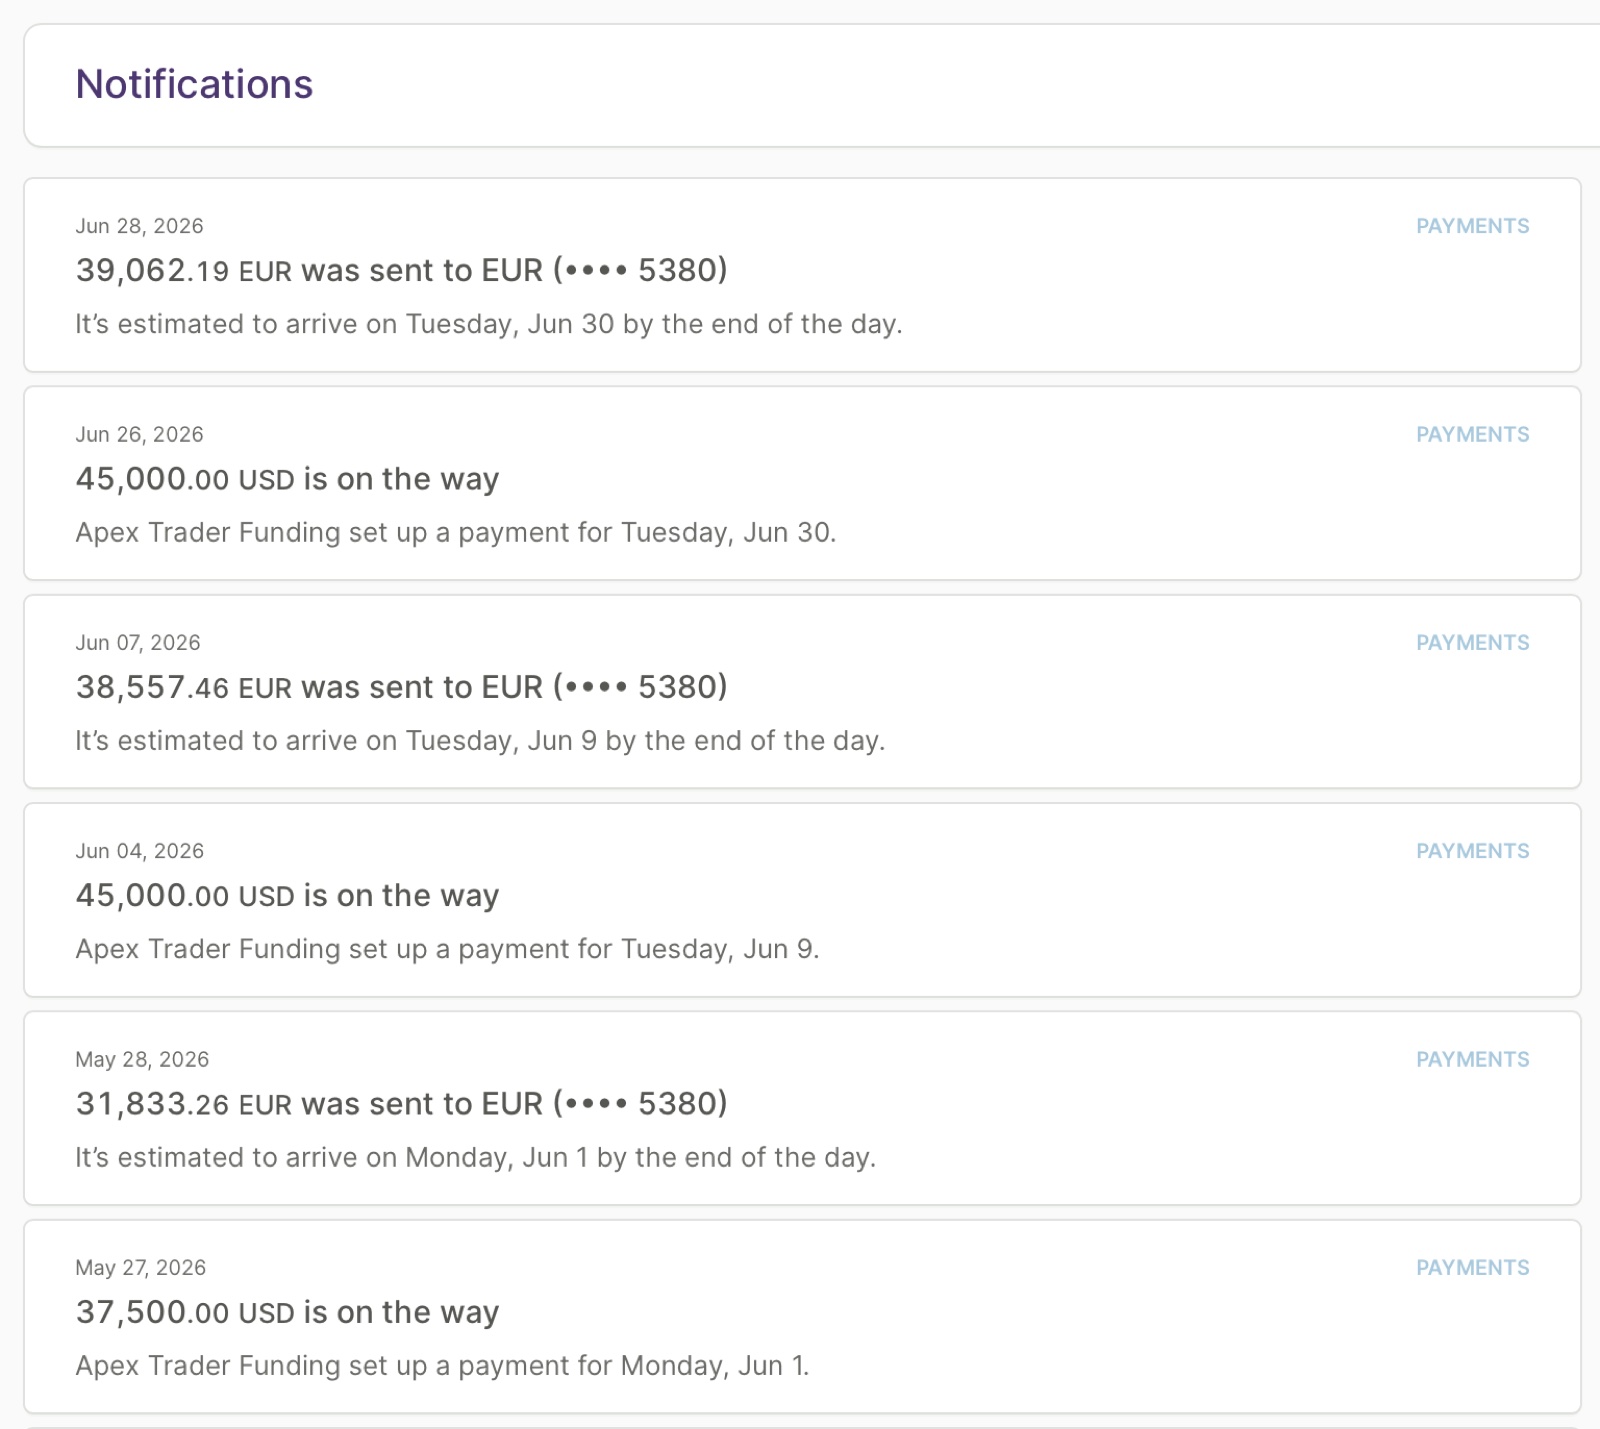
Depuis le lancement de Leversens en février 2026, les payouts tombent en banque tous les mois.
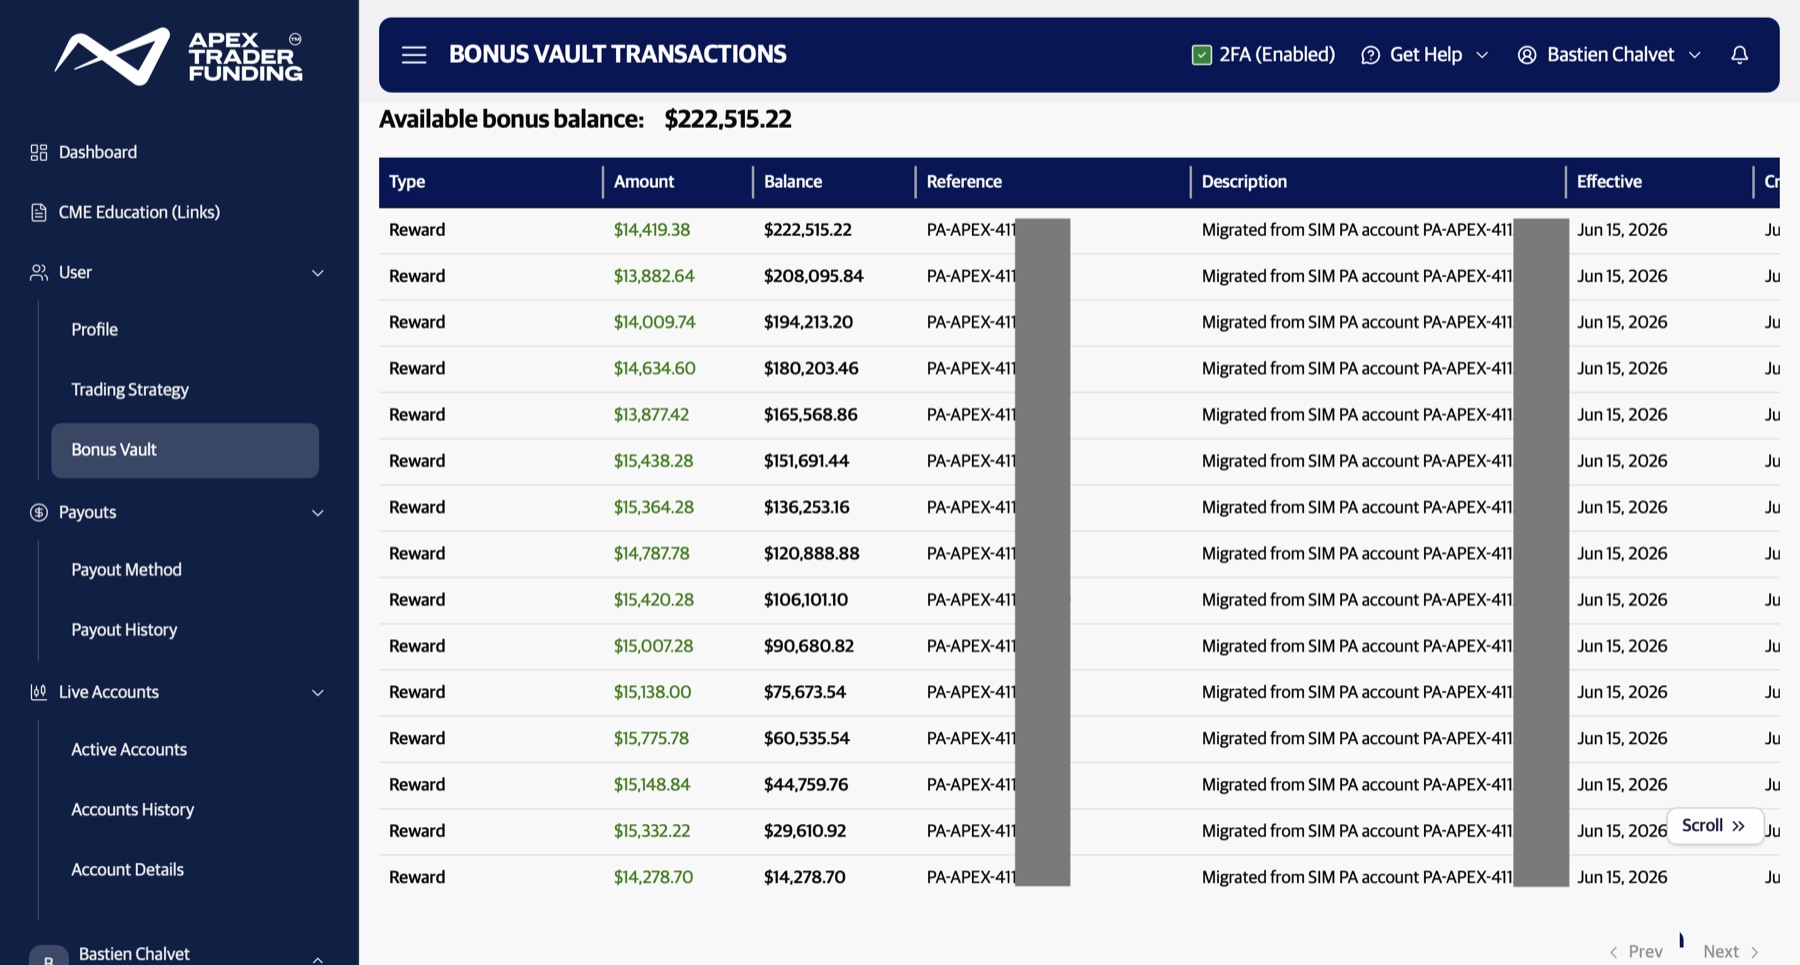
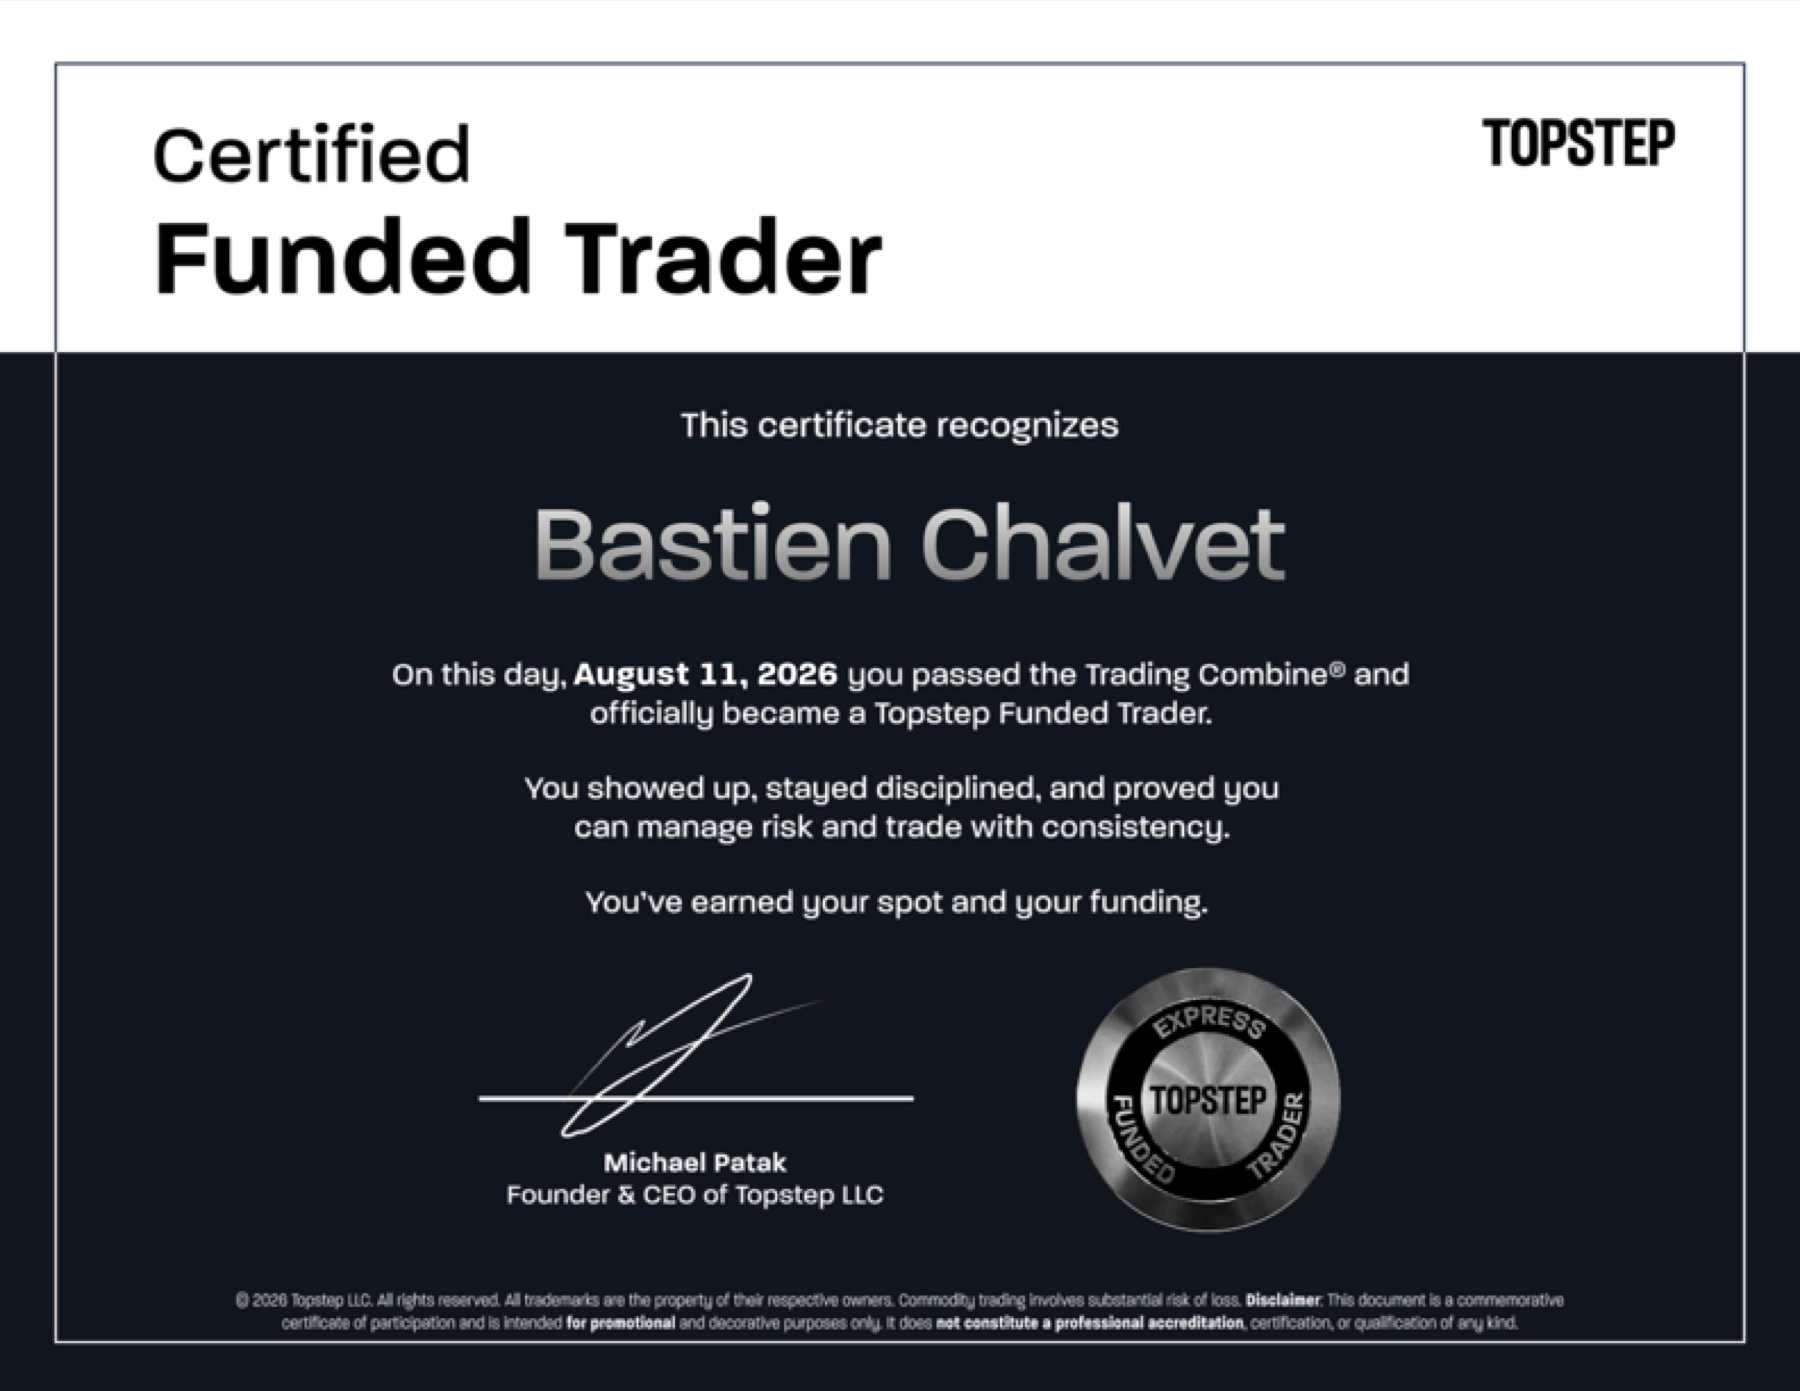
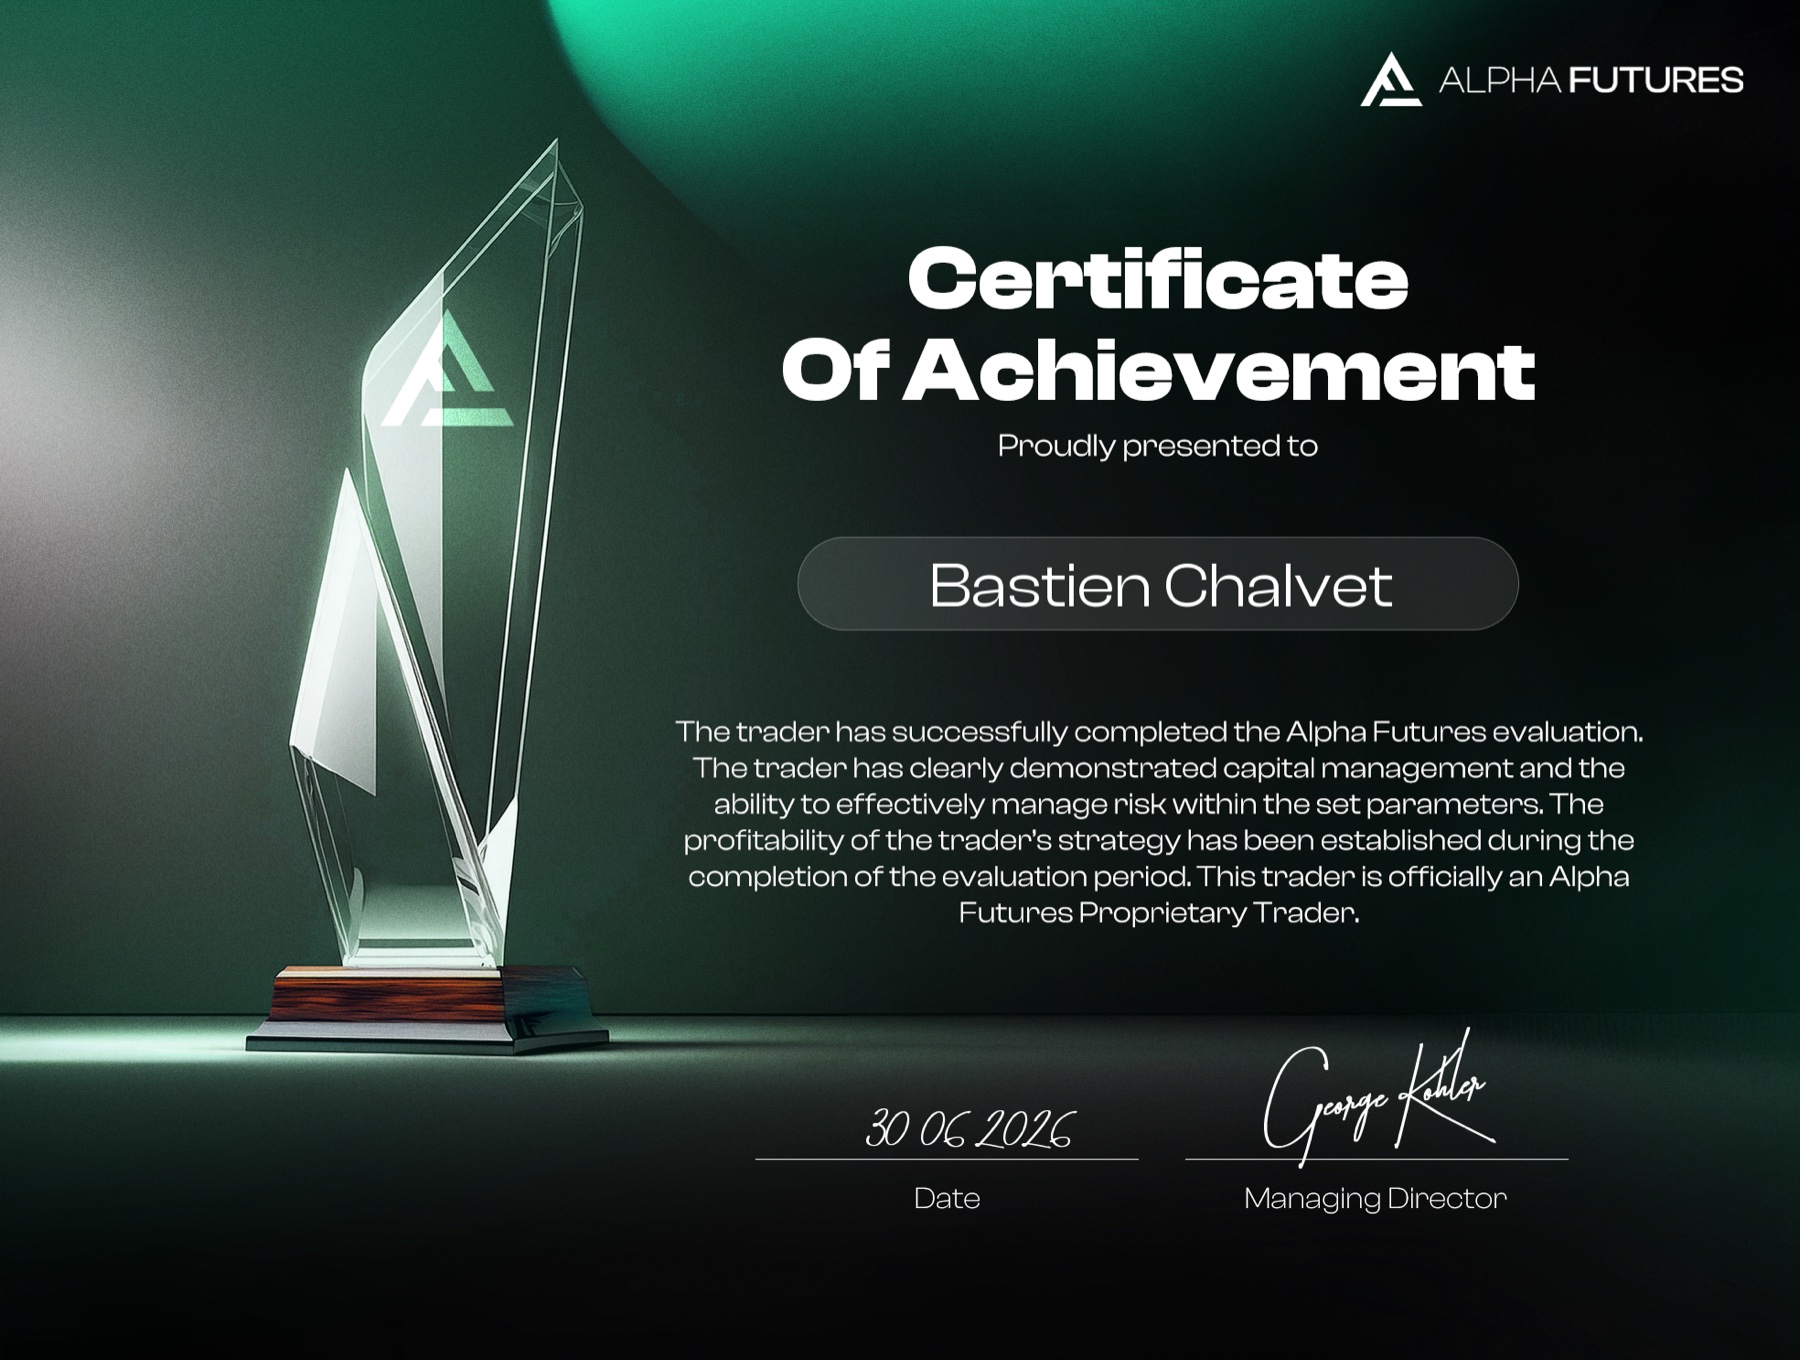
Apex, Topstep, Tradeify, FundedNext, Lucid, Alpha Futures. Des dizaines d'évaluations passées, de comptes financés, et notamment 222 515 $ de vault bonus cumulés chez Apex.



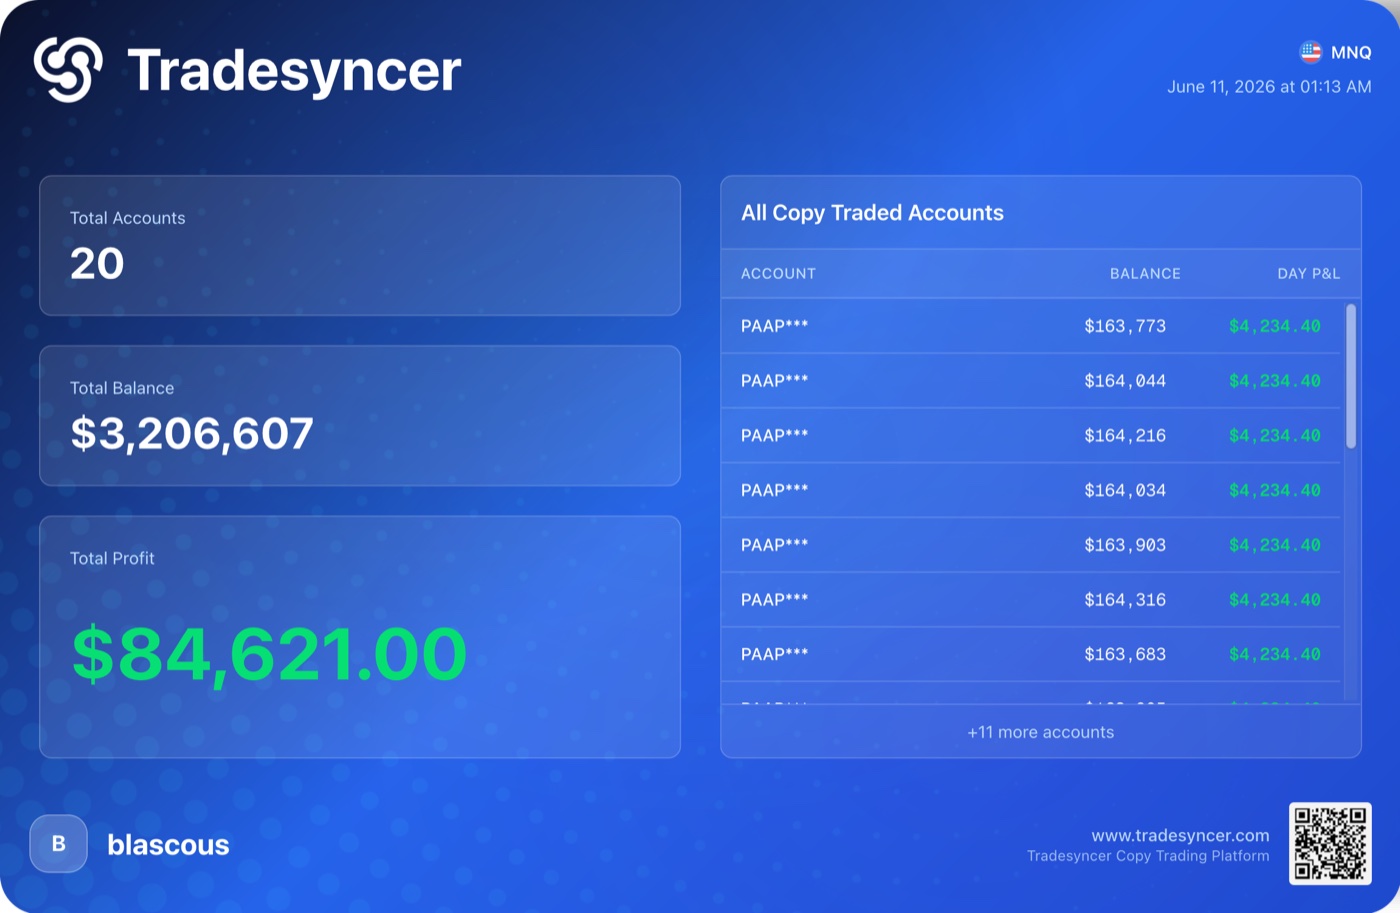
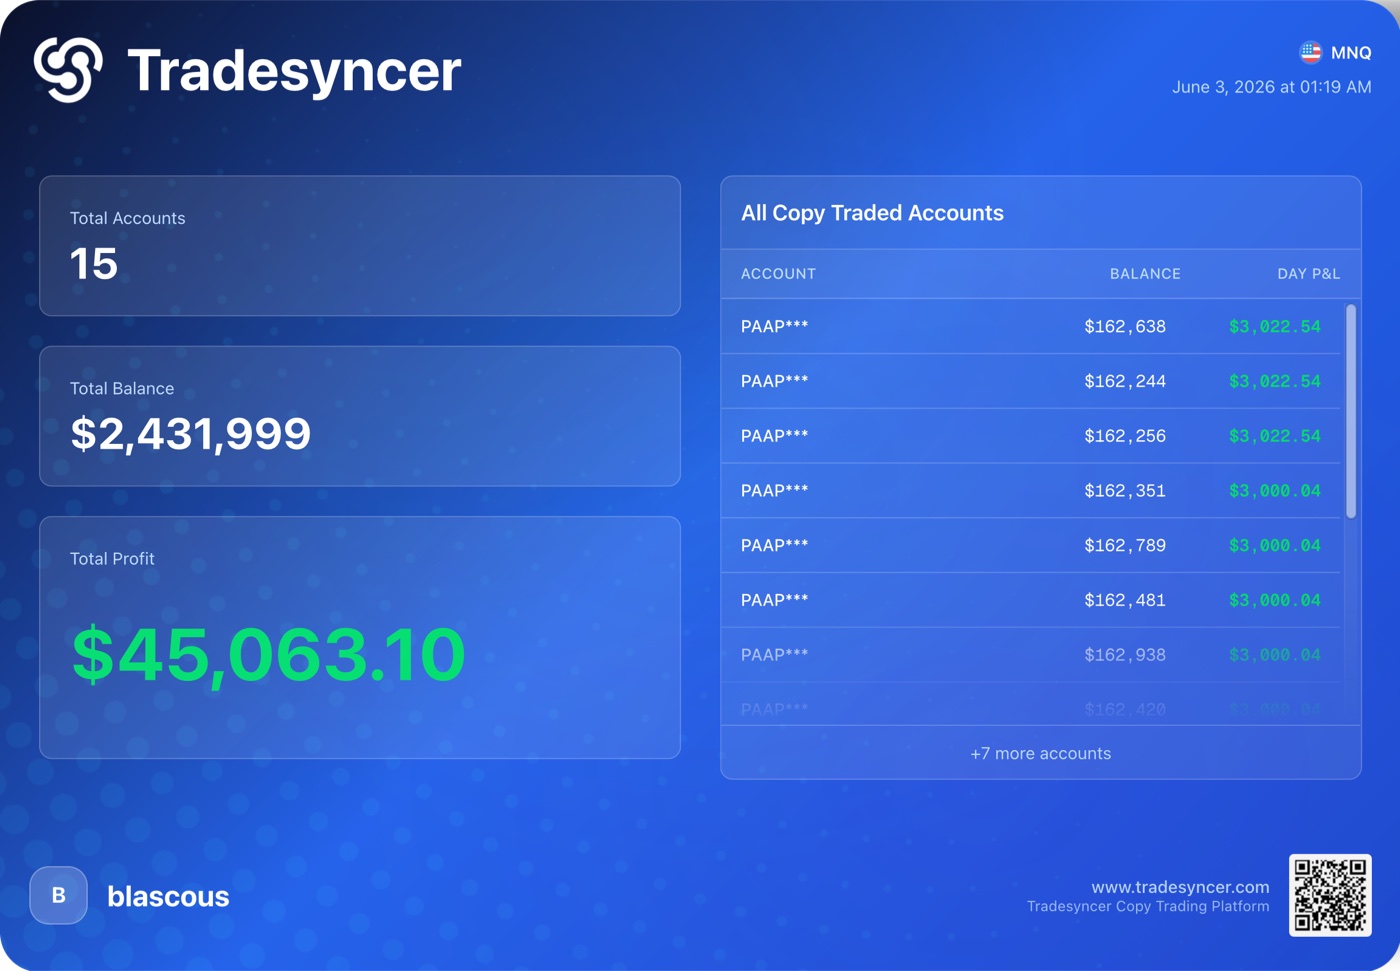
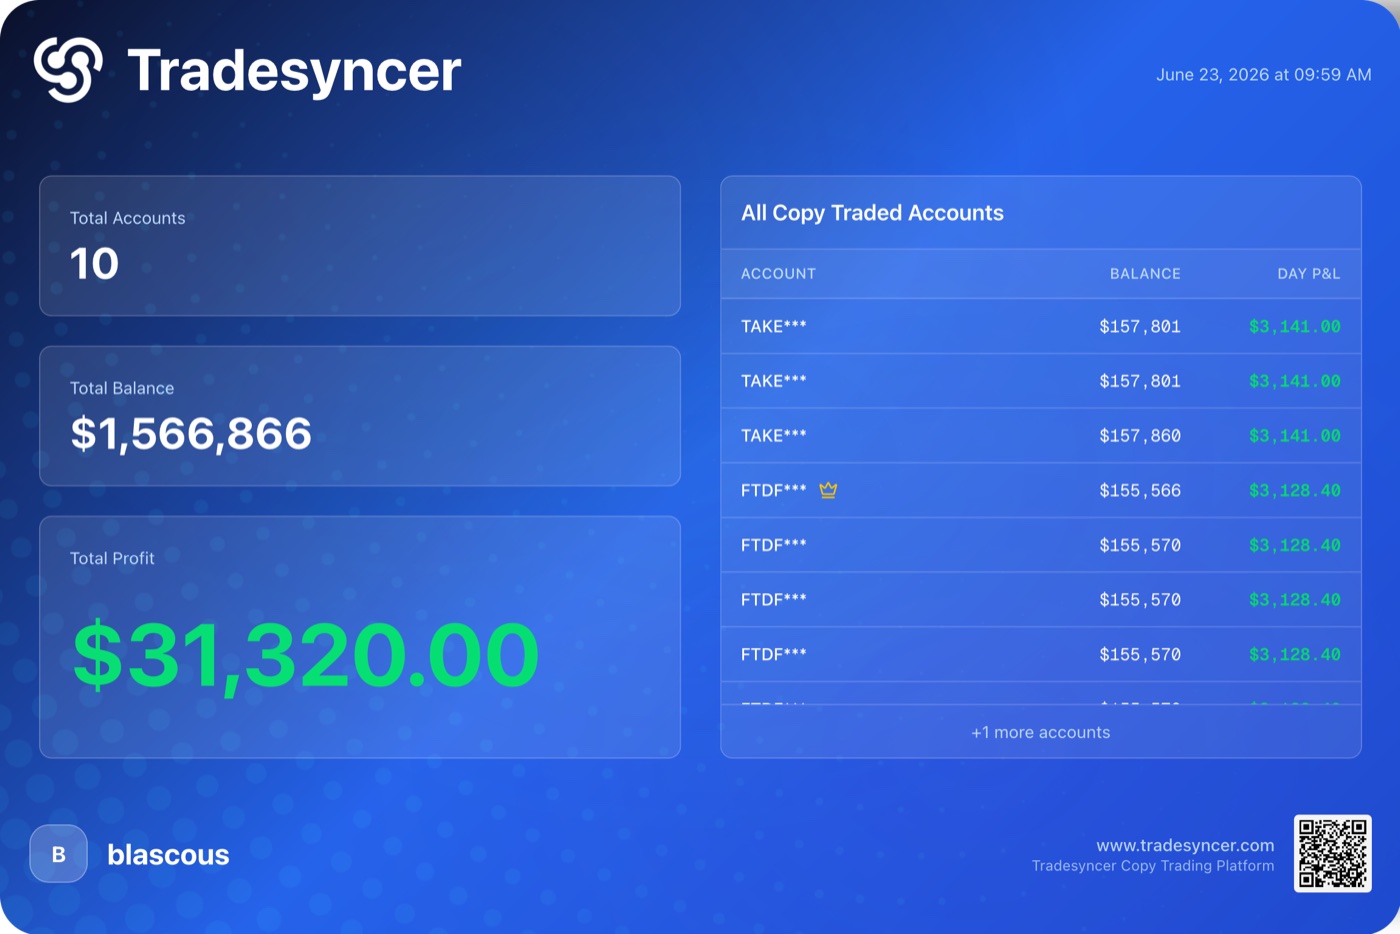
Le 11 juin 2026, sur Tradesyncer. Comme les captures suivantes, elle cumule le PnL de plusieurs comptes copiés dans la même séance.
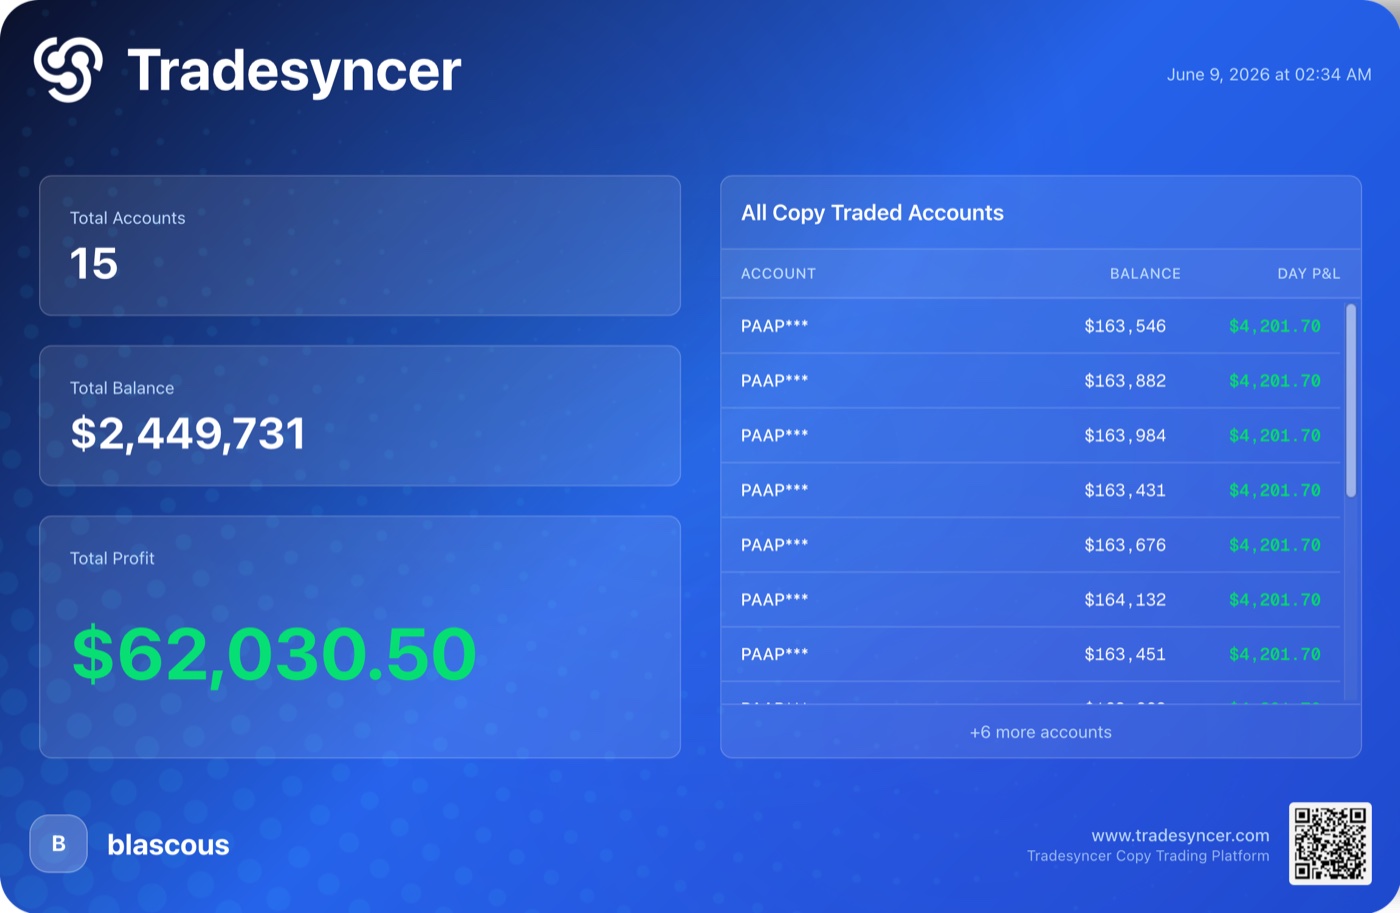
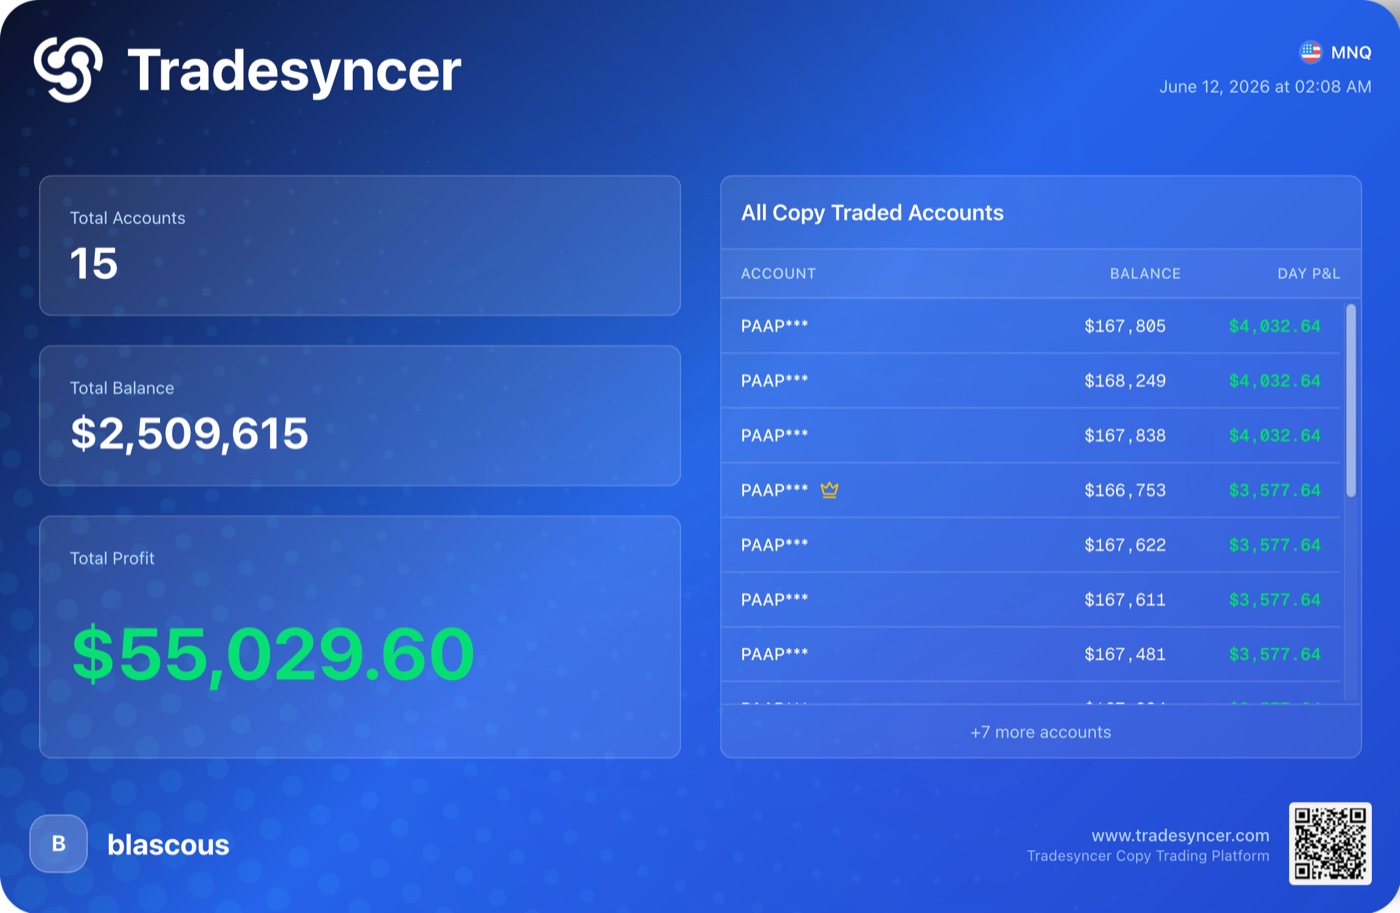
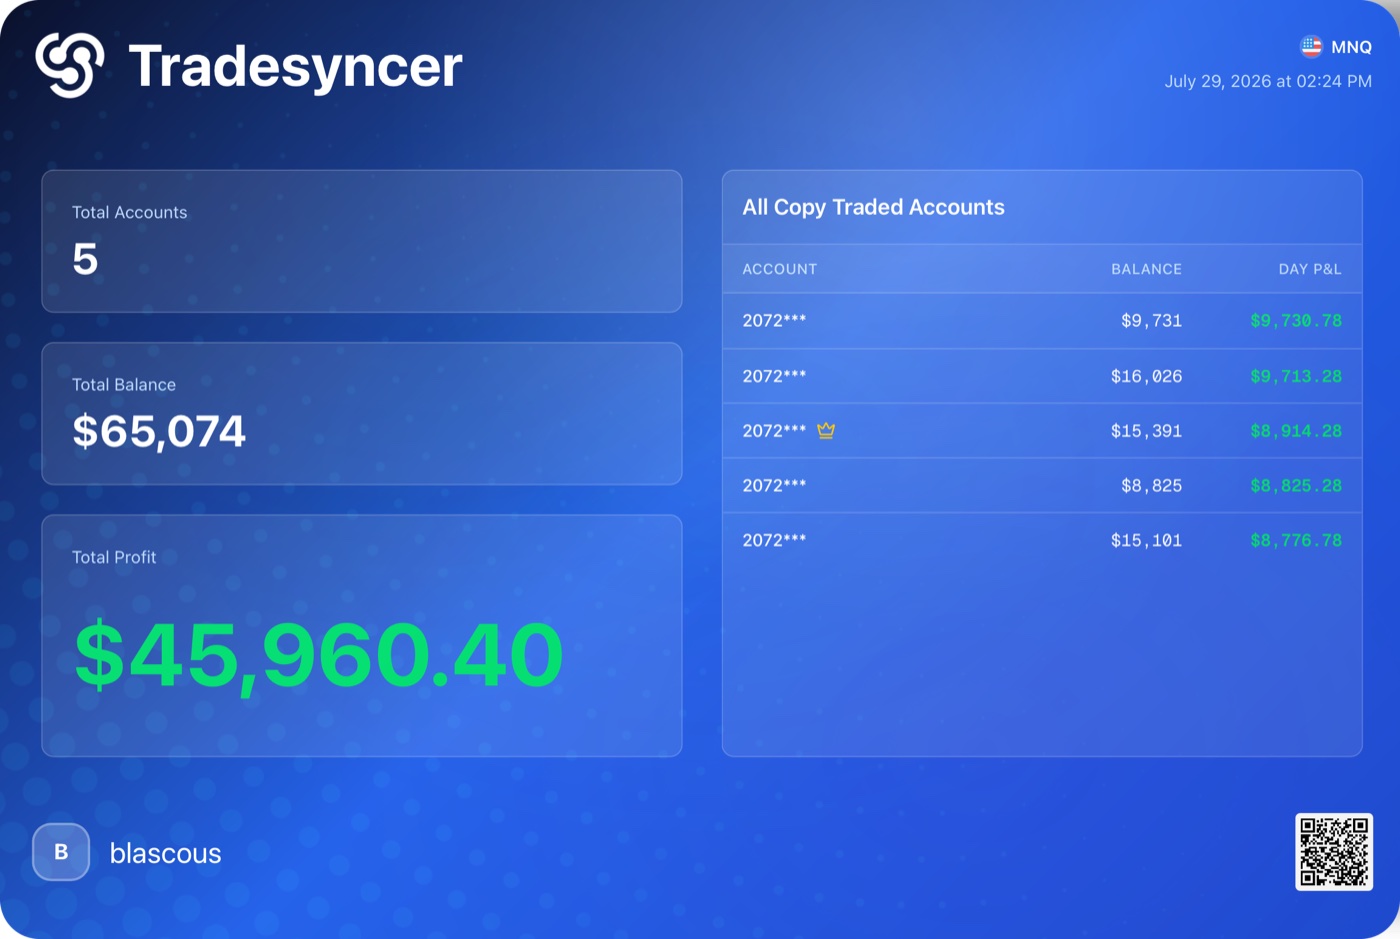
Leversens est le carnet public d'un trader professionnel en prop firm. Les outils, l'algo et les guides publiés ici sont gratuits, sans exception. Rien à vendre, tout à partager.
Le but n'est pas totalement philanthropique, mais de créer une communauté/visibilité qui pourrait me servir dans la suite de ma carrière.